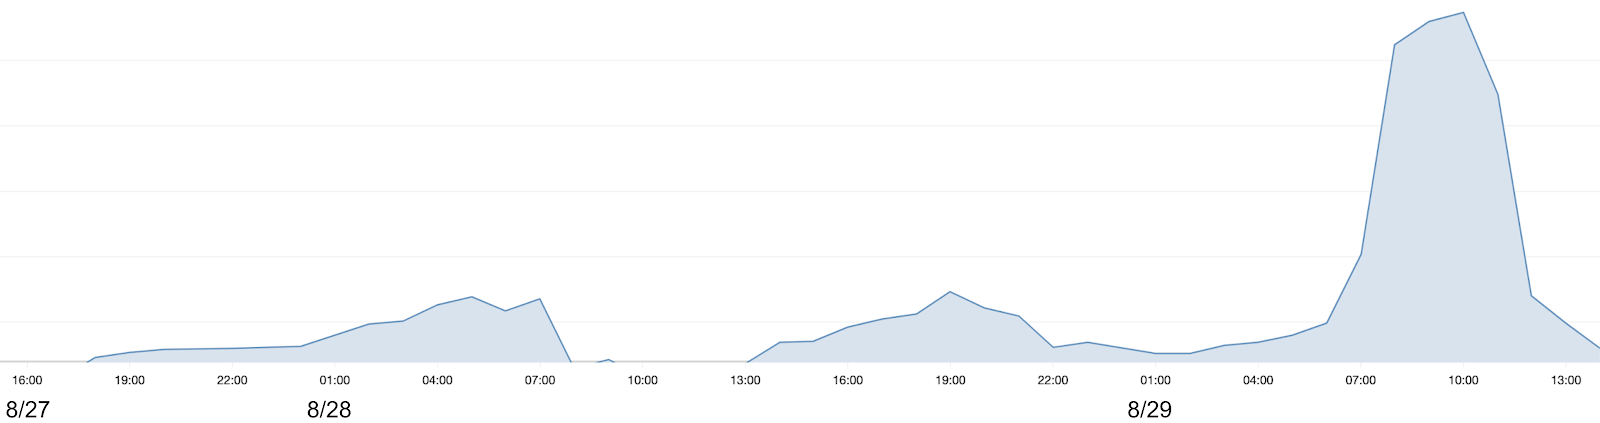
Between 15:30 UTC on 8/27 and 14:00 UTC on 8/29 we experienced periods of higher-than-usual pipeline latencies. Between 04:00 and 10:00 UTC on 8/29 most pipelines were completely stopped. At Etleap we want to be transparent about system issues that affect customers, and this post summarizes the timeline of the incident and our team’s response, and what we are doing to prevent a similar incident from happening again.
What happened and what was the impact?
At around 11:30 UTC on 8/27 our ops team was alerted about spikes in two different metrics: CPU of a Zookeeper node and stop-the-world garbage collection (STW GC) time in a Java process responsible for orchestrating certain ETL activities. The two processes were running in different Docker containers on the same host. From this point onwards we saw intermittent spikes in both metrics and periods of downtime of the orchestration process, until the final fix was put in place at 14:00 UTC on 8/29. Additionally, at 15:30 UTC on 8/27 we received the first alert regarding high pipeline latencies. There were intermittent periods of high latency until 10:00 UTC on 8/29.
Incident Response
When our ops team received the first alert they followed our incident response playbook in order to diagnose the problem. It includes checking on potential causes such as spikes in usage, recently deployed changes, and infrastructure component health. The team determined that the issue had to do with the component that sets up source extraction activities, but found no other correlations. Suspecting an external change related to a pipeline source was leading to the increased garbage collection activity, they went on to attempt to narrow down the problem in terms of dimensions such as source, source type, and customer. Etleap uses a Zookeeper cluster for things like interprocess locking and rate limiting, and the theory was that a misbehaving pipeline source was causing the extraction logic to put a significant amount of additional load on the Zookeeper process, while at the same time causing memory pressure within the process itself. However, after an exhaustive search it was determined that the problem could not be attributed to a single source or customer. Also, memory analysis of the Java process with garbage collection issues showed nothing out of the ordinary.
The Culprit
Next, the team looked at the memory situation for the host itself. While each process was running within its defined memory bounds, we found that in aggregate the processes’ memory usage exceeded the amount of physical memory available on the host. The host was configured with a swap space, and while this is often a good practice, it is not so for Zookeeper: by being forced to swap to disk, Zookeeper’s response times went up, leading to queued requests.
In other words, the fact that we had incrementally crossed an overall physical memory limit on this host caused a dramatic degradation of the performance of Zookeeper, which in turn resulted in garbage collection time in a client process. The immediate solution was to increase the physical memory on this host, which had the effect of bringing Zookeeper stats back to normal levels (along with the CPU and STW GC metrics mentioned before).
Next steps
We are taking several steps to prevent a similar issue in the future. First, we are configuring Zookeeper not to use swap space. Second, we’re adding monitoring of the key Zookeeper stats, such as latency and outstanding connections. Third, we are adding monitoring of available host physical memory to make sure we know when pressure is getting high. Any of the three configuration and monitoring improvements in isolation would have led us to find the issue sooner, and all three will help prevent issues like this from happening in the first place.
While it’s impossible to guarantee there will never be high latencies for some pipelines, periods of high latencies across the board are unacceptable. What made this incident particularly egregious was the fact that it went on for over 40 hours, and the whole Etleap team is sorry that this happened. The long resolution time was in large part because we didn’t have the appropriate monitoring to lead us towards the root cause, and we have learned from this and are putting more monitoring of key components in place going forward.