To ensure a great user experience it is important to keep the initial page load as fast as possible. There are two main ways of doing this; one is to reduce the number of file requests made when the site is loading, and the other is to reduce the size of the files. To automate this it is common to use a tool that combines all your javascript into one minified bundle file.
This is a great way of improving the load times, but to improve it even further manual intervention is required. One way to reduce the file size is to remove unnecessary code and dependencies. If large parts of your code are not required at the first page load, you could also split your bundle into multiple files to reduce the size of the initial bundle. However, when all your files are combined into one bundle it is difficult to know what it consists of and how big the different components are.
Webpack Visualizer
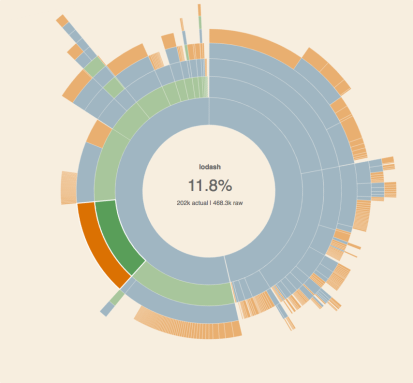
At Etleap we use Webpack to bundle our application. The bundles created are concise and minified, therefore we use Webpack Visualizer to inspect the content. This tool produces a layered pie chart of the included content in the bundle, and allows us to quickly assess the relative size of each file. Here is an example:

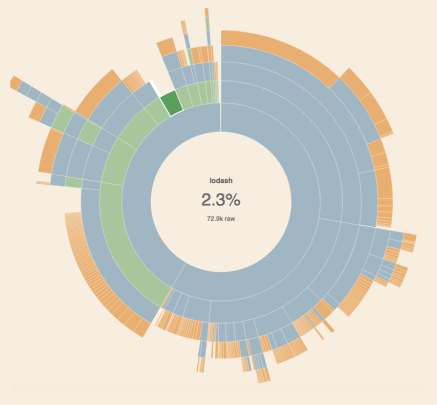
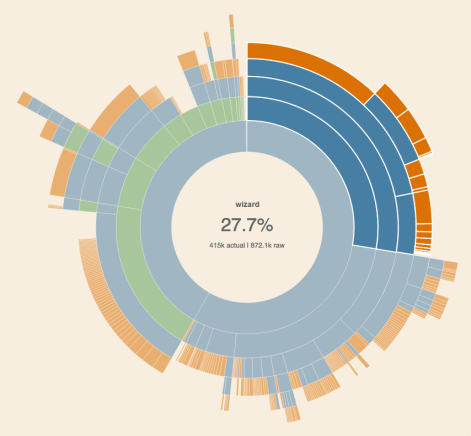
The chart is categorised by folders, with the root folders at the innermost layer of the chart. Files are orange, folders blue, and dependencies are green. By hovering any slice, the size of the slice relative to the bundle is shown. This makes it easy to identify parts of the application that can be optimized for load time.
Reducing dependencies
Through bundle inspection we found that Lodash accounted for 12% of our bundle. After looking through our code we noticed that we only needed a small set of the functionality Lodash provided. Since it supports selective import, ie. only importing the specific functions you require, we managed to reduced the size of Lodash to 2.3%. That is almost a 10% reduction of our total bundle.

If a dependency does not allow you to selectively import functionality, sometimes writing your own implementation of a function can shave off several percent of your bundle if it results in dropping a large dependency.
Identifying splitting points

One of the key components of Etleap is a wizard for setting up data pipelines. Our wizard alone was responsible for almost 30% of our bundle. Since users load our dashboard on the initial load, and usually use the wizard later, we decided to use this as a splitting point. By moving most of the wizard to a separate bundle, leaving only the essentials for a speedy transition, we managed to reduce our initial bundle size by 20%.
How to inspect your own bundle
To use the tool you need to generate a statistics file for your bundle by passing in –json as a parameter to Webpack, and saving the output as a file. This file contains detailed information about your bundle (including your source code!). If you are using an npm script to run your Webpack build, you can use this command to create the file:
npm run <script> — –json > stats.json
There is also a Webpack plugin that will generate the visualisation in a local .html file, if you prefer to use that.
Note that the tool uses the pre-minified bundle so there could be some differences in relative sizes after minification.
